
This tutorial is about how to place a legend below the axes in MatPlotlib in Python. The legend can be set below the axes in Matplotlib in Python. The basic module of SciPy helps deal with mathematics, science, and engineering problems. However, It is important to note one aspect of graph creation that is particularly useful: legends. Your graph will be accompanied by legends, which serve as annotations. Additionally, Graphs can include quantitative and qualitative data, allowing other users to understand and use the meaning behind them.
You can use your favorite editor, Python shell, Syder, and Jupyter notebook. Working on Anaconda→ Jupyter notebook.
However, For Placing a legend below the axes in Matplotlib in Python. You need to import the following libraries into your code shell. First,
- import matplotlib.pyplot as plt,
- import NumPy as np
Let’s discuss libraries or python modules.
Purpose of using the Matplotlib library
- It helps to call the plot() function to acquire some data.
- Furthermore, Make charts and plots in visual form using the show() function.
- Set put the properties (color, labels) of charts and plots
Additionally, the matplotlib provides several ways to place a legend below the axes.
using the matplotlib in Simple example code
The code executes as follows:
- Importing necessary libraries
- Numpy library to deal with arrays, matrices, and transforms(Fourier, Laplace). Moreover, Here we are importing it because we are creating a variety.
- linspace is used to place a number in a plot over a specific interval location.
import matplotlib.pyplot as plt
import numpy as np
#linspace return evenly space number over a specific interval
myarray=np.linspace(0,10,num=5)
print(myarray)
plt.figure()
plt.plot(myarray) #function to plot graph
plt.xlabel('x_axis')
plt.ylabel('Y_axis')
plt.show()
[ 0. 2.5 5. 7.5 10. ]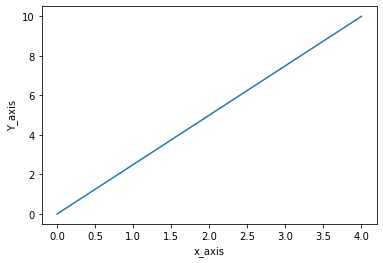
Display legend on Matplotlib Plot
- linspace() function is to return evenly spaced numbers over a specific interval
- plt.plot() function to plot graph
- plt.legend() is a function to show legend. Legends give a meaningful value and labeling to the elements of the plot/chart. They help to read the plot and understand the visuals.
- plt.xlabel() is used to label the x-axis
- plt.ylabel() is used to label the x-axis
- plt.show() function purpose of using them is to show a plot/bar graph at the output.
import matplotlib.pyplot as plt
import numpy as np
myarray=np.linspace(0,10,num=5) #linspace return evenly space number over a specific interval
print(myarray)
plt.figure()
plt.plot(myarray) #function to plot grapgh
#legends gives a meaningful value and labeling to the elements of the plot/chart.
#They helps to read the plot and understand the visuals.
plt.legend(['linear']) # Function to show legend
plt.xlabel('x_axis')
plt.ylabel('Y_axis')
plt.show()
[ 0. 2.5 5. 7.5 10. ]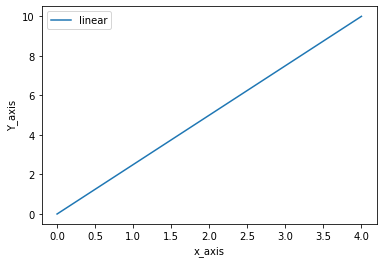
How to set a legend below the axes in the matplotlib in python?
It was so moving to the topic after the discussion on legend and matplotlib, how to place a legend below the axes in matplotlib in python.
The procedure is straightforward.
- You need to specify the position in the “loc” function.
- bbox_to_anchor is required to adjust the axis according to our needs. To adjust the legend outside the plot, you need tuples to adjust it. Bbox specifies the bounding box. It allows us to pass four arguments (x0,y0, width, and height). By default, if there are two values in a list, then the other two widths and heights are pre-set to zero.
fig = plt.figure()
myarray=np.linspace(0,10,num=5) #linspace return evenly space number over a specific interval
print('myarray=', myarray)
fig=plt.figure()
plt.plot(myarray) #function to plot grapgh
labels = ["Linear"]
plt.legend(labels, loc="lower center", bbox_to_anchor=(0.5, -0.3, 0, 0))
plt.xlabel('x_axis')
plt.ylabel('Y_axis')
fig.subplots_adjust(bottom=0.1)
#fig.subplots_adjust(bottom=padding) is used to adjust the space between the axes and the legend

plt.show()
myarray= [ 0.   2.5  5.   7.5 10. ]
<Figure size 432x288 with 0 Axes>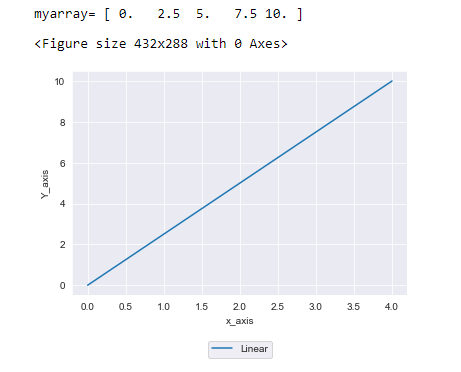
In matplotlib, add a figure outside to your plot containing information about the legend, which will be used for labeling the elements in the plot/charts. However, In this example, we have labeled the legend as “linear.”
Conclusion
In summing up the whole topic, the first and most straightforward way to place a legend below the axes in matplotlib in Python is to use the bbox_to_anchor() function. Moreover, This function takes two or four values as arguments—a list of axes values (x0,y0) and a list of width and height. However, The first two items in the list are the values of your axes, so you can set up your plot wherever you want to place your legend. It will create a figure with legend information on it. Then you can plot that legend below the axes through the plt.legend() function. The third item in your list is the width you want for your figure, and the fourth item is what type of height you want to display for your label. Hopefully, This article finds you helpful and clears your doubts.